
⏱️ Quick Navigation
⏱️Performance & Fitness Assessments
Measure more than just strength. Assess fitness, conditioning, movement quality, power output, running performance and practical gym metrics to better understand your current level and track progress over time.
These calculators are designed for educational purposes and provide estimates based on the information entered. Results should be interpreted alongside body composition, lifestyle, fitness levels, and individual circumstances.

Running & Conditioning
Assess aerobic fitness, pacing, endurance and cardiovascular performance using practical running and conditioning calculators designed to help you train smarter, improve fitness and track measurable progress over time.

Pace Calculator
What Is a Pace Calculator?
A Pace Calculator helps estimate your running pace, finish time or required speed based on a chosen distance. Whether you’re training for a 5K, 10K, half marathon or simply improving your cardiovascular fitness, it provides a practical way to plan and monitor your performance.
Why It Matters
- Helps calculate pace, speed and predicted finish times
- Supports race preparation and pacing strategies
- Assists with planning running and conditioning workouts
- Tracks improvements in endurance and cardiovascular fitness over time
Important to Know
Running pace is only one measure of performance. Factors such as aerobic fitness, running economy, terrain, weather conditions, recovery, nutrition and training consistency can all influence results. Use pace data alongside other fitness and recovery metrics for a more complete picture of your progress.
Running Pace Calculator Premium Tool
Calculate your pace, speed, and finish times
? Pace Tip: For optimal performance, aim for consistent pacing throughout your run.
Race Time Predictor Calculator
What Is a Race Time Predictor?
A Race Time Predictor estimates your potential finish times across various race distances based on a recent running performance. By using your current pace and race results, it helps set realistic goals and plan future training more effectively.
Why It Matters
- Predicts finish times for different race distances
- Helps set realistic performance goals
- Assists with race pacing and preparation
- Tracks improvements in endurance and conditioning
- Useful for planning training cycles and competitions
Important to Know
Race predictions are estimates based on mathematical models and assume consistent fitness across distances. Actual race performance may be influenced by training history, pacing strategy, terrain, weather, nutrition, recovery and race-day conditions. Use predictions as guidance rather than guaranteed outcomes.
Race Time Predictor Premium Tool
Predict your race times across all distances based on a known performance
? Race Time Predictor: Based on Jack Daniels' formula. Predictions are estimates and individual results may vary.
Heart Rate Zones Calculator
What Are Heart Rate Zones?
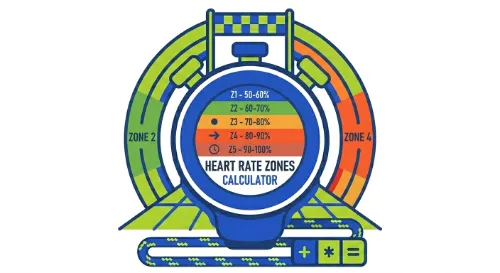
Heart Rate Zones are training intensity ranges based on your heart rate. Each zone represents a different physiological demand, helping you target specific fitness adaptations such as recovery, fat oxidation, aerobic endurance, lactate threshold development and high-intensity performance.
Why It Matters
- Helps train at the appropriate intensity for your goals
- Improves cardiovascular fitness and endurance performance
- Assists with fat loss and calorie expenditure strategies
- Prevents training too hard or too easy
- Supports structured and evidence-based programming
Important to Know
Heart rate zones are estimates based on formulas that predict your maximum heart rate and training thresholds. Individual responses can vary depending on genetics, fitness level, medications, stress, sleep, hydration and environmental conditions. Use heart rate data alongside perceived exertion, performance metrics and recovery indicators for the most accurate assessment of training intensity.
Heart Rate Zones Calculator Premium Tool
Calculate your personalized heart rate training zones using multiple formulas
? Training Tip: Zone 2 is ideal for building endurance. Zone 4 improves lactate threshold. Zone 5 develops VO2 max.

VO₂ Max Calculator
What Is VO₂ Max?
VO₂ Max is a measure of your body’s ability to use oxygen during exercise and is considered one of the best indicators of cardiovascular fitness and aerobic endurance. Higher VO₂ Max values generally reflect a greater capacity to perform sustained physical activity and recover more efficiently between efforts.
Why It Matters
- Measures cardiovascular fitness and aerobic capacity
- Helps assess overall endurance performance
- Tracks improvements in conditioning over time
- Assists with exercise programming and goal setting
- Useful for runners, cyclists, team sport athletes and general fitness enthusiasts
Important to Know
VO₂ Max estimates are based on validated field tests and predictive equations rather than laboratory gas analysis. While these methods provide useful insights into aerobic fitness, factors such as test effort, pacing, environmental conditions, fatigue and individual physiology can influence results. Use your VO₂ Max score alongside other performance and health metrics for a more complete picture of your fitness.
VO₂ Max Calculator Premium Tool
Estimate your cardiorespiratory fitness with Fitness Age and comprehensive ratings
| Rating | Male (20-29) | Male (30-39) | Male (40-49) | Female (20-29) | Female (30-39) | Female (40-49) |
|---|---|---|---|---|---|---|
| Superior | ≥60 | ≥56 | ≥52 | ≥54 | ≥50 | ≥46 |
| Excellent | 55-59 | 52-55 | 48-51 | 49-53 | 46-49 | 42-45 |
| Good | 50-54 | 47-51 | 44-47 | 43-48 | 40-45 | 37-41 |
| Fair | 44-49 | 41-46 | 38-43 | 38-42 | 35-39 | 32-36 |
| Poor | 37-43 | 34-40 | 31-37 | 32-37 | 29-34 | 26-31 |
| Very Poor | ≤36 | ≤33 | ≤30 | ≤31 | ≤28 | ≤25 |
? VO₂ Max Tip: This is an estimate. For the most accurate measurement, consult a sports medicine professional for a lab test. Regular cardiovascular exercise can improve your VO₂ max and fitness age.

Everyday Activity Tools
Simple calculators to help you stay active, increase daily movement and monitor treadmill-based exercise.
Treadmill Speed & Pace Calculator
What Is a Treadmill Speed & Pace Calculator?
A Treadmill Speed & Pace Calculator converts running speed into pace and vice versa, helping you accurately set treadmill workouts and understand how your training speed translates to real-world running performance. It can display values in both kilometres and miles, making it useful for a wide range of fitness goals.
Why It Matters
- Converts treadmill speed into running pace instantly
- Helps set accurate speeds for interval and endurance workouts
- Supports race preparation and pacing strategies
- Makes it easier to follow running programmes
- Allows quick conversion between metric and imperial units
Important to Know
Treadmill running and outdoor running are not always identical due to factors such as wind resistance, terrain changes and treadmill calibration. For most recreational runners, treadmill and outdoor paces are very similar, but small differences may occur. Use pace and speed data alongside perceived effort and heart rate for the best training results.
Treadmill Speed & Pace Calculator Premium Tool
Convert between treadmill speed and running pace. Calculate distance, time, and effort.
? Treadmill Tip: 1% incline on a treadmill simulates outdoor running effort. The faster you run, the more incline matters!
Daily Step Goal Calculator
What Is a Daily Step Goal Calculator?
A Daily Step Goal Calculator estimates the number of steps you should aim for each day based on your activity level, lifestyle and fitness goals. Whether your objective is improving health, increasing daily movement, supporting weight management or enhancing overall fitness, step targets provide a simple and practical way to monitor physical activity.
Why It Matters
- Encourages regular daily movement
- Helps reduce sedentary behaviour
- Supports weight management and calorie expenditure
- Improves cardiovascular health and general fitness
- Provides a simple and measurable activity target
Important to Know
Step count is a useful indicator of daily activity, but it is only one aspect of overall health and fitness. Exercise intensity, strength training, cardiovascular fitness, sleep, nutrition and recovery also contribute to long-term results. Use step goals as part of a balanced and sustainable approach to physical activity.
Daily Step Goal Calculator Premium Tool
Set personalized daily step goals based on your weight, goal, and activity level
? Step Tip: Start with a realistic goal and increase gradually by 500-1000 steps per week. Consistency is key!
Recovery Readiness Calculator
What Is a Recovery Readiness Calculator?
A Recovery Readiness Calculator evaluates key recovery indicators to estimate how prepared your body is for training. By considering factors such as sleep quality, muscle soreness, fatigue, stress levels and recent training load, it helps determine whether you are ready to train hard, should reduce intensity or may benefit from additional recovery.
Why It Matters
- Helps optimise training performance and recovery
- Reduces the risk of excessive fatigue and overtraining
- Supports better workout and programme decisions
- Encourages awareness of recovery habits and lifestyle factors
- Helps balance training stress with recovery capacity
Important to Know
Recovery readiness scores are estimates and should be used as guidance rather than absolute rules. Individual responses to training can vary significantly based on fitness level, training experience, nutrition, hydration, sleep quality and life stress. Always consider how you feel physically and mentally alongside any calculated readiness score.
Recovery Readiness Calculator Premium Tool
Assess your recovery status and determine if you're ready to train
Complete the assessment to see your recommendation.
? Recovery Tip: A recovery score above 70% indicates you're ready for high-intensity training. Between 50-70% suggests moderate intensity. Below 50% means you should focus on light activity or active recovery.
Fitness Age Calculator
What Is a Fitness Age Calculator?
A Fitness Age Calculator estimates your biological fitness age based on key health and performance indicators rather than your chronological age. By assessing factors such as cardiovascular fitness, body composition, physical activity levels and lifestyle habits, it provides an estimate of how your fitness compares to population averages.
Why It Matters
- Provides a practical measure of overall fitness status
- Helps identify areas for health and performance improvement
- Can be more meaningful than body weight alone
- Tracks long-term changes in fitness and lifestyle habits
- Encourages healthy behaviour and regular physical activity.
Important to Know
Fitness age is an estimate and should not be considered a medical assessment. Results are influenced by the information entered and the prediction models used. Factors such as cardiovascular fitness, strength, body composition, nutrition, sleep, stress management and daily activity all contribute to overall fitness age. Use this result as a motivational and educational tool rather than an exact measurement.
Fitness Age Calculator Premium Tool
Discover your true biological age based on your cardiovascular fitness level
Calculate your fitness age to see your results.
? Fitness Age: A lower fitness age than your chronological age indicates better cardiovascular fitness and a lower risk of chronic disease. Research shows improving your fitness age by 10 years can reduce your risk of early death by up to 50%.

Strength Sports and Power Performance
Assess strength, power and athletic performance using calculators designed for powerlifting, Olympic weightlifting and explosive training.
Olympic Weightlifting Sinclair Calculator
What Is the Sinclair Calculator?
The Sinclair Calculator is the internationally recognised method used in Olympic weightlifting to compare performances between athletes of different bodyweights. By applying a Sinclair coefficient to an athlete’s total, the calculator provides a standardised score that allows fair comparisons regardless of weight class.
Why It Matters
- Compares Olympic weightlifting performance across different bodyweights
- Provides a standardised measure of lifting ability
- Commonly used in Olympic weightlifting competitions and rankings
- Helps track long-term progress and performance development
- Allows fair comparison between lifters in different weight categories
Important to Know
The Sinclair Formula is updated periodically by the International Weightlifting Federation (IWF) to reflect current world-record standards. While Sinclair scores are excellent for comparing Olympic weightlifting performance, they should be interpreted alongside technical proficiency, training age, competition experience and overall athletic development.
Olympic Weightlifting Sinclair Calculator Premium Tool
Compare lifting performances across weight classes using the official IWF Sinclair formula
? Sinclair Score: The higher the Sinclair total, the better the adjusted performance. This allows fair comparison across all weight classes in Olympic weightlifting.
Olympic Weightlifting Total Calculator
What Is an Olympic Weightlifting Total Calculator?
An Olympic Weightlifting Total Calculator combines your best successful Snatch and Clean & Jerk lifts to determine your Olympic Weightlifting Total. The total is the primary measure used in Olympic weightlifting competitions and provides a simple way to track overall lifting performance and progress.
Why It Matters
- Calculates your official Olympic Weightlifting Total
- Tracks overall strength and performance development
- Helps monitor progress over time
- Allows comparison with previous training and competition results
- Provides a benchmark for goal setting and programme planning
Important to Know
Your Olympic Weightlifting Total reflects both strength and technical proficiency across the Snatch and Clean & Jerk. While the total is an important performance metric, factors such as lifting technique, mobility, speed, coordination and consistency also play critical roles in Olympic weightlifting success. Use your total alongside other performance indicators for a more complete assessment of progress.
Olympic Weightlifting Total Calculator Premium Tool
Calculate your competition total, lift balance, and performance metrics
? Weightlifting Tip: A healthy C&J to Snatch ratio is typically between 80-83%. If your ratio is above 85%, your Snatch is relatively weak. Below 78%, your C&J is relatively weak. Total-to-bodyweight is a key indicator of relative strength.
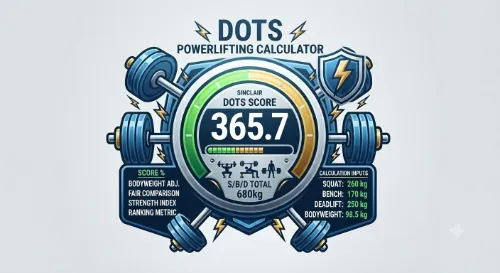
Powerlifting DOTS Calculator
What Is the DOTS Calculator?
The DOTS Calculator is a widely used powerlifting scoring system that compares strength performance across different bodyweights. By applying a bodyweight-adjusted coefficient to your powerlifting total, the DOTS score allows fair comparisons between lifters regardless of size or weight class.
Why It Matters
- Compares powerlifting performance across different bodyweights
- Provides a standardised measure of overall strength
- Commonly used in powerlifting rankings and competitions
- Helps track long-term strength development
- Allows fair comparison between lifters in different weight categories
Important to Know
The DOTS score is calculated using your Squat, Bench Press and Deadlift total along with your body weight. While it provides an excellent indicator of relative strength, it should be considered alongside factors such as lifting technique, training age, competition experience and overall athletic development. A higher DOTS score generally reflects greater strength relative to body weight.
Powerlifting DOTS Calculator Premium Tool
Calculate your DOTS score to compare powerlifting performance across all weight classes
? DOTS Score: A higher DOTS score indicates better relative strength. Compare scores across bodyweights to find the strongest pound-for-pound lifter. DOTS is the modern replacement for Wilks.
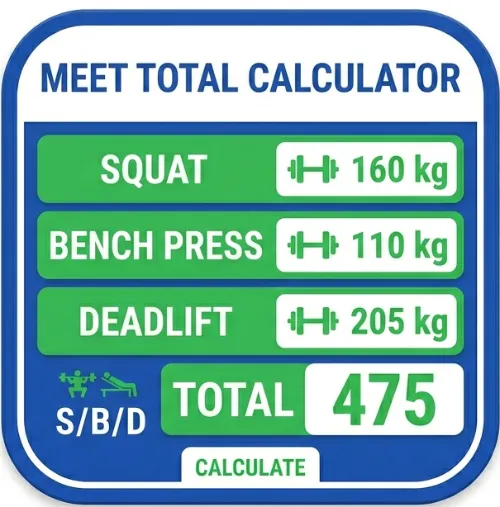
Powerlifting Meet Total Calculator
What Is a Powerlifting Meet Total Calculator?
A Powerlifting Meet Total Calculator combines your best successful Squat, Bench Press and Deadlift attempts to determine your official powerlifting total. This total is the primary measure used in powerlifting competitions and provides a clear benchmark of overall strength performance.
Why It Matters
- Calculates your official powerlifting competition total
- Tracks overall strength development across the three competition lifts
- Helps set realistic performance goals
- Allows comparison with previous competitions and training cycles
- Provides a benchmark for strength progression over time
Important to Know
Your powerlifting total reflects performance in the Squat, Bench Press and Deadlift, but it is only one measure of success. Factors such as lifting technique, body weight, competition experience, attempt selection and recovery also influence overall performance. Use your total alongside other strength metrics to gain a more complete picture of your progress.
Powerlifting Meet Total Calculator Premium Tool
Calculate your competition total and analyze your lift distribution and relative strength
? Meet Analysis: A balanced powerlifter typically has a Squat:Bench:Deadlift ratio of approximately 1:0.7:1.2. If your ratios differ significantly, consider focusing on the weaker lift.
Vertical Jump Calculator
What Is a Vertical Jump Calculator?
A Vertical Jump Calculator measures lower-body explosive power by analysing jump height and, in some cases, body weight. Vertical jump performance is widely used in sports performance testing because it reflects an athlete’s ability to generate force rapidly and produce explosive movements.
Why It Matters
- Assesses lower-body power and explosiveness
- Helps monitor athletic performance and training progress
- Useful for sports requiring jumping, sprinting and rapid acceleration
- Supports strength and power programme evaluation
- Provides a simple and practical measure of athletic ability
Important to Know
Vertical jump performance is influenced by multiple factors including strength, power, technique, coordination, body composition and fatigue levels. Results should be interpreted alongside other performance assessments such as sprint speed, strength testing and sport-specific skills. Consistent testing conditions are important for accurate comparisons over time.
Vertical Jump & Power Calculator Premium Tool
Calculate your vertical jump height, power output, and performance classification
| Classification | Male (cm) | Female (cm) | Power (W/kg) |
|---|---|---|---|
| 🏆 Elite | ≥70 | ≥60 | ≥60 |
| 🌟 Excellent | 60-69 | 50-59 | 50-59 |
| 💪 Good | 50-59 | 40-49 | 40-49 |
| ✅ Average | 40-49 | 30-39 | 30-39 |
| 📉 Below Average | 30-39 | 20-29 | 20-29 |
| ⚠️ Poor | <30 | <20 | <20 |
💡 Vertical Jump Tip: The Lewis formula is used to estimate power output: Power (W) = √4.9 × Body Mass (kg) × √Jump Height (m) × 9.81. A higher power-to-weight ratio is better for explosive sports like basketball, volleyball, and sprinting.
Sprint Performance Suite
What Is the Sprint Performance Suite?
The Sprint Performance Suite combines sprint speed, power output and anaerobic capacity assessments to provide a comprehensive overview of explosive athletic performance. By analysing sprint times, body weight and performance data, it helps evaluate an individual’s ability to generate speed, power and high-intensity energy production.
Why It Matters
- Assesses sprinting speed and acceleration ability
- Evaluates lower-body power production
- Measures anaerobic performance and high-intensity capacity
- Helps monitor athletic development and training progress
- Supports performance testing for sport and conditioning programmes
Important to Know
Sprint performance is influenced by multiple factors including strength, power, technique, body composition, mobility, training experience and recovery status. Calculator results provide useful estimates and benchmarks but should be interpreted alongside sport-specific performance measures and practical testing. Consistent testing conditions are recommended for accurate progress tracking.
Sprint Performance Suite Premium Tool
Complete speed, power, and anaerobic capacity analysis for athletes
| Classification | Speed (m/s) | Power (W/kg) |
|---|---|---|
| ? Elite | ≥9.0 | ≥25 |
| ? Excellent | 8.0-8.9 | 22-24 |
| ? Good | 7.0-7.9 | 19-21 |
| ✅ Average | 6.0-6.9 | 16-18 |
| ? Below Average | 5.0-5.9 | 13-15 |
| ⚠️ Poor | <5.0 | <13 |
? Sprint Performance: Speed, power, and anaerobic capacity are key indicators of athletic performance. Use these metrics to track progress and identify areas for improvement.